It is just case story.
I had got a report with IP results for interpretation.
This results in that the interpretation of such data is impossible.
This case shows how important it is to analyze field data before interpretation.
|
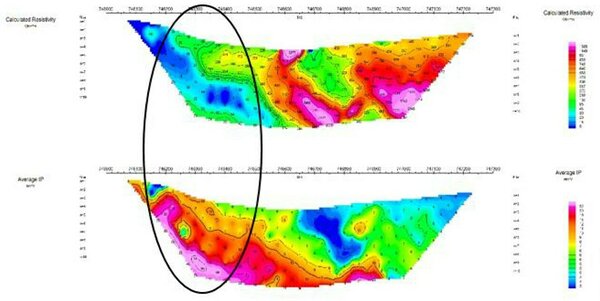
One line with IP anomaly from Report. The pictures quality was very poor. | |
|
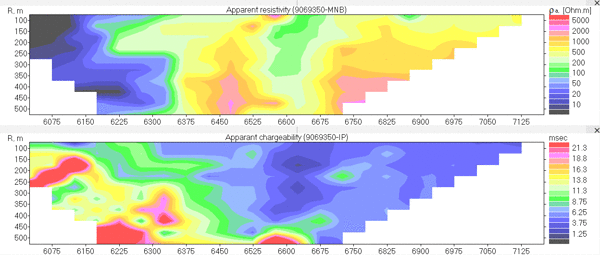
Same line in x2ipi (reference point is MN center)
| |
|
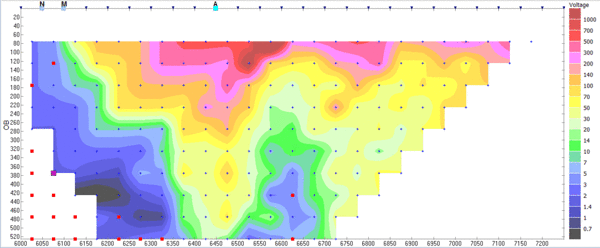
Left lower corner is blanked since values of apparent resistivity are less than zero. The measured voltage there is less than 1 mV. | |
|
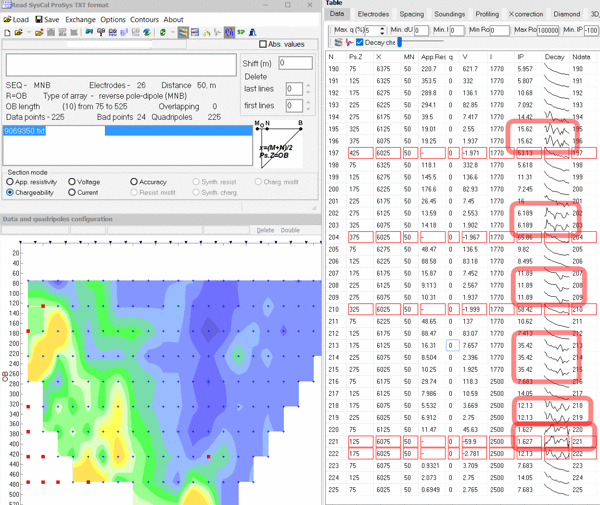
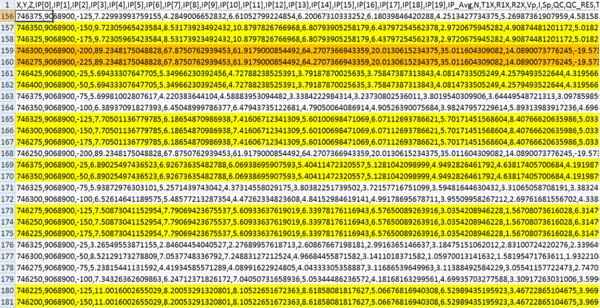
Let's look at IP decay curves. They are the same for some readings.
| |
| Identical values in the field data is a result of Copy-paste. All results with a negative IP have been replaced by measurements from another part of line. The data table confirms this conclusion. It is just cheating. |
This case shows how important it is to analyze field data before interpretation.
Write first comment